Prepper demographics updated with 2020 FEMA survey data: over 20M people in the US alone!
Editor’s note: Colonel Chris Ellis, PhD, directs a disaster cell for the US military at India-Pacific Command. In part via his fellowship as a Goodpaster Scholar at Cornell University, he’s spent years analyzing data about the preparedness community.
The last time we analyzed FEMA survey data, it caused a bit of a splash, becoming #1 on google for “prepper demographics” and leading to a wave of mainstream press coverage about how this community has grown and moved into the mainstream. (Such as today’s 60 Minutes episode about the market growth!)
But that was using 2018 pre-Covid data (which is released years later), and we’ve since been anxious to get hands on the data FEMA collected after the pandemic changed everything. Everyone’s been expecting that Covid — and everything else that’s made ’20-22 so much fun — did nothing but continue to pour fuel on the fire of this growing community.
I’ve finished crunching the numbers using FEMA phone surveys collected in the first half of 2020, comparing it with annual data from the National Household Survey (NHS) going back through 2017.
So this does capture the Covid effect, but perhaps may have been too soon to really reflect the long-term changes, as people were still caught in the chaos the first months of 2020, just trying to figure out how to get toilet paper or not be a cat on their courtroom Zoom. The future batch of data that covers ‘20-21 should be more telling.
Key takeaways:
- The number of people who can handle >31 days of self-reliance grew 50% over the 2017-20 period.
- The 20 million US preppers mark has solidly been crossed. If you use the broader definition of a prepper as someone who can handle at least two weeks of disruption, the number gets even higher.
- That means around 7% of all US households were actively working on self-reliance in ’19-20, solidly increasing from 2% to 3% then 5% in recent years. 10% is only a matter of time.
- While the “basic preppers” segment was consistently growing year over year before Covid, the “advanced preppers” segment had been flat or even shrank a little — but that trend reversed in 2020, showing that many people saw the need to go beyond the basics in response to world events.
- Nothing major changed around geography: the same states that prep a lot (eg. Montana) and those that don’t (eg. Washington D.C.) stayed in their relative rankings. Islanders, such as people in Hawaii and Puerto Rico, continue to prep at rates 50% higher than mainlanders.
- Rural households are still more likely than urbanites to prep, but we continue to see strong growth among city dwellers.
- Asians disproportionately embraced prepping in ’20, which perhaps makes sense given what they may have been hearing from friends and family back in Asia during early Covid combined with some of the anti-Asian racism that grew in the US in ’20.
- Perhaps most surprising: the trend in recent years was that preppers were getting younger. But that trend reversed in 2020, with the average age actually increasing a little to 52.6. The number of younger preppers still grew — 25-34 year olds are still the largest segment on The Prepared — but there was even more growth among the older crowd during this period.
- There’s some weird results in this data, though, which show there’s still a disconnect between reality and how a typical household thinks about risk. But we’ve started getting a peek at the ’21 data, where FEMA changed some of the survey questions to be clearer, and I think it will result in better data going forward.
While the term “prepper” is ill-defined quantitatively, in my research I use a simple heuristic from the NHS: how long can you survive at home without publicly provided water, power, or transportation? I quantify anyone with 31 days or more of self-reported preparedness as a Resilient Citizen. Those with 30 days or less are Regulars. Highly Resilient Citizens (HRCs) have 90 days or more and Ultra-High Resilient Citizens (UHRCs) are at 97 or more days (the maximum allowed response in FEMA’s survey).
Preparedness trends
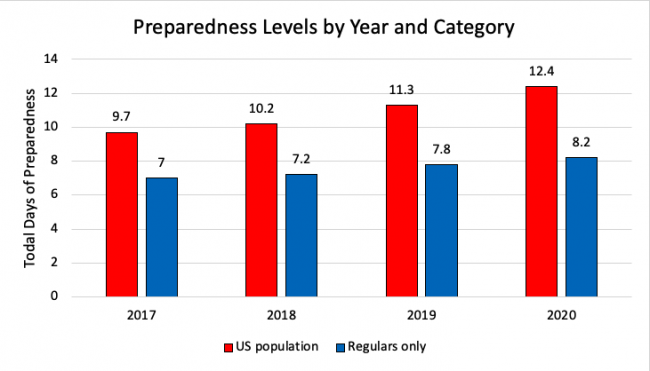
Americans collectively have increased their levels of disaster preparedness from 2017 to 2020. For Regulars, the effect is small – an average of seven days in 2017 to just over eight days in 2020 – but still measurable. For this group, each year saw a slight increase. When including Resilient Citizens and averaging all Americans, the mean jumped from just under 10 days of resilience in 2017 to 12.4 days in 2020.
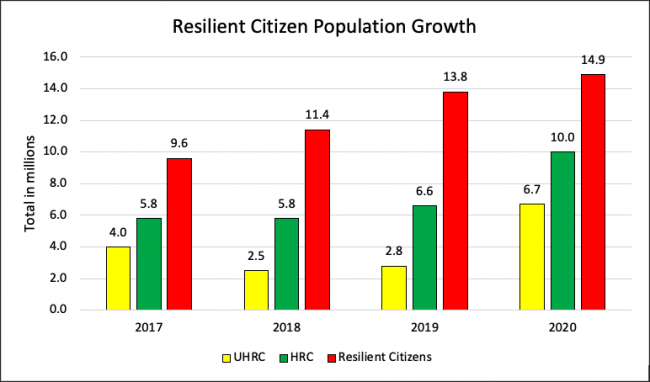
The overall number of Resilient Citizens in America has also increased every year. In 2017, approximately four out of every 100 people was a Resilient Citizen. In 2020 it had increased 50% to nearly six per 100. In sheer numbers this means 14.9 million Americans had 31 days or more of at-home preparedness in 2020. Ultra-Highly Resilient Citizens (97 days or more of preparedness) jumped from four million people in 2017 to 6.7 million in 2020. There is still a heavy stereotype against “preppers,” but as more people prepare from across the political spectrum – and in various ways – the stigma appears to be slowly eroding.
Geography
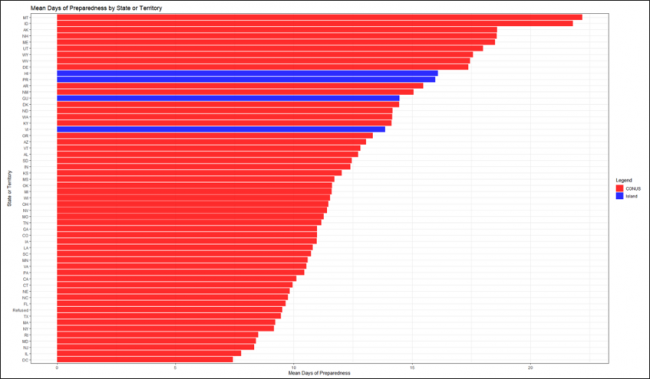
Where do these households reside? I analyzed the data in two different ways. First was by US state or territory. Generally speaking, lower population, rural states have the highest rates of preparedness. Montana, Idaho, Alaska, New Hampshire, Maine, Utah, Wyoming, West Virginia, Delaware, and Hawaii make up the top ten, in descending order (i.e. Montana had the highest average). The lowest average states were, with the exception of Texas and Illinois, all east coast states or the District of Columbia (Washington, DC was the lowest, followed by Illinois, New Jersey, Maryland, Rhode Island, New York, Massachusetts, Texas, Florida, and North Carolina). A cursory look at yearly changes, by state, yielded no discernable pattern. California and Florida saw annual increases in Resilient Citizens all four years, but Texas and New York saw random fluctuation.
Another pattern that held from my previous research was that of higher aggregate rates of preparedness in US islands (Hawaii, Guam, Puerto Rico, US Virgin Islands). The four-year average of residents of island locales indicates preparedness rates ~50% higher than those on the mainland (15.7 days versus 10.8 days respectively). I maintain my original conjecture that primary drivers of this disparate finding are a “fear of state failure” coupled with an inability to easily flee larger disasters for island residents.
A second way to geographically analyze the data is by an urban-rural delineation. The US Department of Agriculture bins zip codes into one of ten population density categories (1 = an urban area with 50,000 people or more, 10 = rural at less than 2,500 people). There is a positive correlation between ruralness and higher levels of preparedness across all Americans. 80% of Regulars surveyed lived in an urban area. However, a sizable two-thirds of all self-identified Resilient Citizens and 56% of UHRCs lived in an urban area as well.
Race
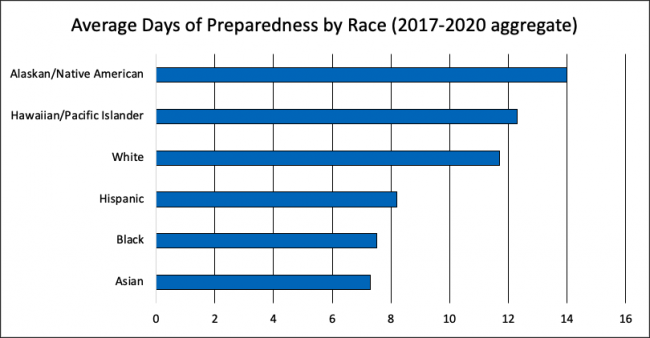
In regard to race, the four-year aggregates of all Americans yields that the category “Alaskan or Native American” had the highest average at 14 days of preparedness. After this was Hawaiians/Pacific Islanders, then Whites, Hispanics, Blacks/African Americans, and Asians, in that order. Whites and Blacks saw yearly increases while the other races had fluctuations. Asians were very stable from 2017-2019 but saw a major jump in 2020. Several possibilities explain this latter finding: increased discrimination, higher cultural or social transmission of preparedness, news consumption patterns, or affinity to stories emanating from China and Asia writ large at the beginning of COVID.
The story among Resilient Citizens is slightly different. For four-year aggregates, Hawaiians/Pacific Islanders topped the list at 92 days, followed by Alaskans/Native Americans (79 days), then Hispanics (77), Whites (76), Blacks (71), and Asians (65). A large word of caution is in order here though, with all races other than Whites, the number of minority resilient citizens is quite low in any given year. There are not enough respondents in these categories for me to confidently depict any racial patterns among Resilient Citizens on a yearly basis. Relatedly, when conducting multi-variate analysis and controlling for things such as income, education, and an urban vs. rural home location, the variable of race was a poor indicator of being a Resilient Citizen or not. The maximum observed impact across numerous calculations was only 2%.
Age
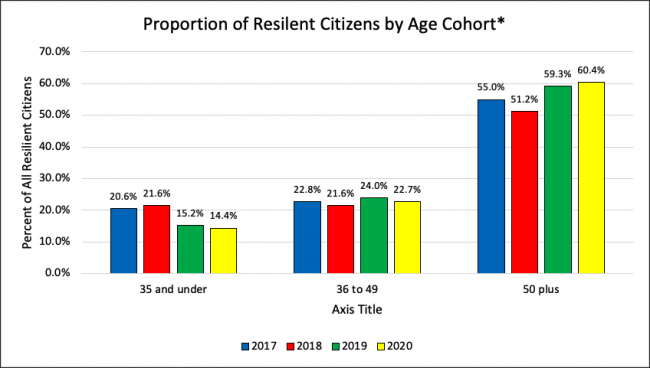
Resilient Citizens are slightly older (52.6 years old) overall than Regulars (51.7), but this difference is less than a year. Interestingly though, the steady growth in Resilient Citizens is NOT among the young. The 35 and under crowd make up a much smaller percentage of Resilient Citizens in 2020 (14.4%) than they did in 2017 (20.6%). Comparatively, growth in those aged 36-49 is nearly 50% and for those 50+ it is 62% from 2017 to 2020. Isolating those 60 and over saw a near doubling; the increase was 92%! Some of this differentiation between young and old could be due to income levels and overall net worth.
Other variables
In all of the data analyzed, the most shocking finding to me was the reported rates of experiencing a disaster. FEMA asked, “Have you or your family ever experienced the impacts of a disaster?” Among all respondents, the 2020 data – in the midst of COVID – was slightly down as compared to 2017. Among all Resilient Citizens, it was down nine full percentage points. The 2020 survey was conducted in the summer of 2020, at the height of the first lockdown and several months before any vaccines were developed and available.
A higher percentage of women reported being Resilient Citizens in 2020 than in 2017, but the numbers were too small for any statistical significance. Another interesting jump was in the number of Resilient Citizens with a disability. There was a 50% increase from 2017 to 2020. Of note, the FEMA data indicated, at best, only a 3% rise in disabilities in the overall population during the same timeframe.
Among preparedness circles is the concept of “bugging out”. That is, quickly leaving your home at – or just prior to – disaster onset with an already assembled bag of emergency supplies. Among Regulars, even though they reported higher rates of at home preparedness, their reported ready-to-go rates saw no discernable patterns among the four years studied. By contrast, Resilient Citizens reported a 35% jump in bug-out readiness in 2019 and maintained that new high in 2020.
Homeowner’s insurance levels increased in both groups slightly, however there were just three years of data, so this could be observed randomness. Money saved for an emergency increased among Regulars but decreased among Resilient Citizens. My hunch is that Resilient Citizens converted cash into preps.
What didn’t change? Education levels between Regulars and Resilient Citizens continues to be nearly equal across all four years. Income levels were relatively stable with Resilient Citizens on average earning a few thousand dollars more per year than Regulars. Resilient Citizens still report higher levels of confidence in their ability to take the steps necessary to prepare for a disaster than Regulars. Resilient Citizens also maintain they are far more likely to have had a disaster plan for at least a year.
Looking forward to 2021 data
FEMA has just released the 2021 National Household Survey raw data. The survey instrument has undergone some substantial changes. First of all, it’s a larger query of America. 2021’s sample size is around 7,200 people versus the roughly 5,000 per year in each of the 2017-2020 datasets. Secondly, some of the key questions have been modified. For example, people are no longer asked their monthly income, but rather their annual income. I personally think this will yield clearer results.
Another question modification that will have significant impact on comparing 2021 to previous years is my key variable of days of total survival at home. 2021’s new survey instrument no longer asks about how long one could last at home without power, water, or transportation. It now breaks these down into separate questions. For example: “How long could you live in your home without power?” And, the answers are no longer discrete numbers, but rather chronological heuristics such as “More than one week” or “More than three months.” If you assume that those who answered at more than one month and more than three months, combined, for both the power question and the running water question are analogous to Resilient Citizens, then the percentage of Americans in 2021 at this higher level is now 8.3%, or roughly 21.5 million Americans. Analysis is ongoing and I hope to release findings in 2023.
-
Comments (9)
-